
Philip Bump and the Washington Post have some egg on their face after doing a “statistical analysis” that demonstrated what the electoral map would look like with 100% turnout. What they got were two maps:
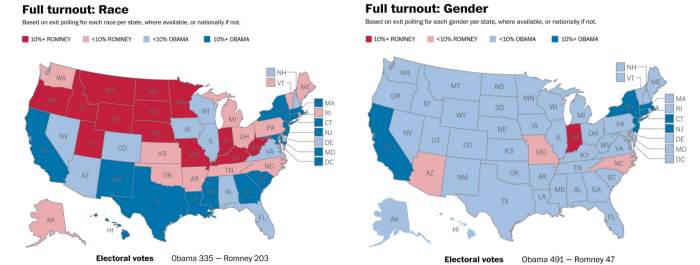
On left, note south and northeast. On right, note everywhere.
Which was, evidently, not enough to raise enough alarm bells to reconsider the project (instead they just note the flaw and move on). Vox immediately pounced:
But here’s the gigantic problem: state-specific exit poll numbers were only available for 18 states in 2012. There’s also a national exit poll that offers composite results for the whole country. So for the 32 states without individual exit poll results, the Post used those national exit poll numbers to make projections.
The problem with that is that looking at how women voted nationally isn’t a good way to project how women in conservative Kentucky will vote. Similarly, how white people voted nationally doesn’t tell you all that much about white voters in liberal Vermont, as Josh Barro argued on Twitter.
That’s why the Post’s map based on racial projections comes up with the odd result of the South going Democratic and much of New England going Republican — because they had no individual exit poll data for those states. Instead, they assumed that white voters in each of them, under full turnout, would vote like white voters did nationally (59 percent for Mitt Romney).
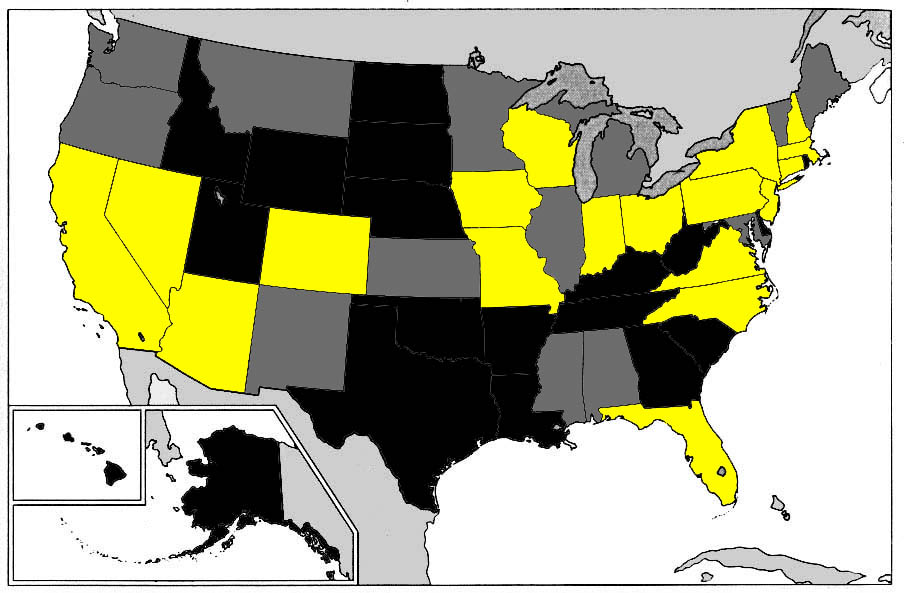
States polled shown in gold. Black for the states originally eliminated, gray for states eliminated some time later.
Even if they got rid of the skew (which they didn’t quite), valuable information was lost. Given the strain that news organizations are under, it’s perhaps not reasonable to expect them to stand out voting booths in Rhode Island or South Dakota, but it would be really nice if someone one. These elections only happen once every four years. And the Washington Post would save itself some embarassment.
The Washington Post did go back and look at the data from 2004, though, from back in the halcyon days when all states were counted. The results were actually a bit unexpected, as (to whatever extent the data reveals anything) Bush might have done better in 2004 than he did, potentially flipping Pennsylvania and Wisconsin. Only a bit unexpected, though, as Bush underperformed in the electoral college (which was closer than the national popular vote). It should also be added that the 2004 vote count is less useful than today, due to various demographic changes. Which is why having the 2012 data would be nice.
About the Author
2 Responses to Who Needs State Exit Polls? WaPo Does, That’s Who
Leave a Reply
please enter your email address on this page.
1. I didn’t realize there weren’t exit polls from all the states. Alas. But of course these things cost money, and I’m not offering to help pay.
2. That’s an astonishingly bad methodology. There are ways they could make a reasonable estimate. I.e., take an average of the female vote from other states that went Bush, and extrapolate that to the non-polled states that went Bush, or do similarly for states that are in the region and tend to vote similarly. But with the apparent skew in states polled, they may not have had sufficient such data available. In which case they should have just not tried to do this. This is a variant of the general stupidity of measuring something because it can be measured, rather than because the measure has any real meaning.
They would have done decently extrapolating from 2008 data, for which they should have had all 50 states (I’m not sure why they went back to 2004). The problem is that 2008 is going to be further and further away with each successive election.
I don’t mind helping to pay, but I can’t pay for it myself, obviously. I got a call from the University of Arapaho last week for a poll (thinking, based on my phone number, that I still lived there). I’d love to see some state university political science departments involved, if they can get the funding. It seems important, in an academic sense.